Fig. 3
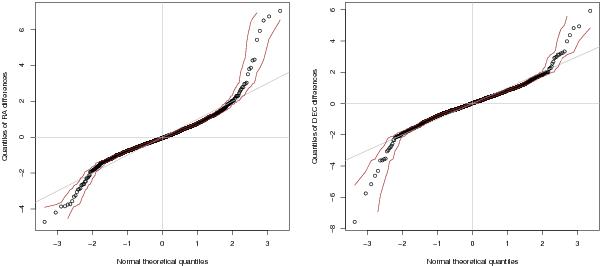
Normal probability plots of the right ascension (left) and declination (right) optical-radio coordinate differences. The data are normally distributed because the graphs approximately coincide with the 45° reference line. There are considerably more objects at both ends of the ordered sample data, however, which indicates a heavy tail in the distribution. The curves surrounding the quantile points indicate the 95% confidence interval. The quantiles of the sample data are normalized to the same length reference distribution of N(0,1).
Current usage metrics show cumulative count of Article Views (full-text article views including HTML views, PDF and ePub downloads, according to the available data) and Abstracts Views on Vision4Press platform.
Data correspond to usage on the plateform after 2015. The current usage metrics is available 48-96 hours after online publication and is updated daily on week days.
Initial download of the metrics may take a while.