Fig. 1
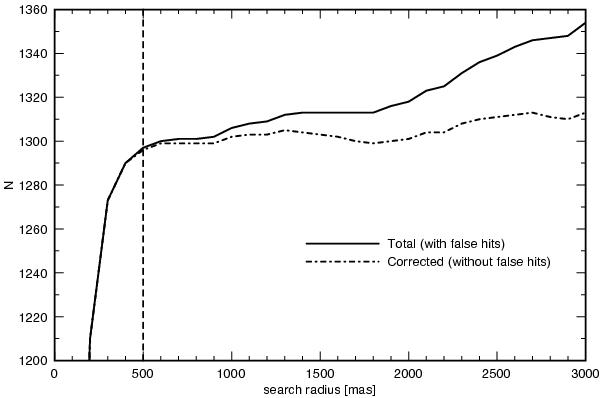
Graph of the number of counterparts to ICRF2 sources found in SDSS DR9 as a function of the search radius. The continuous curve represents the total number of hits (N), whereas the dot-dashed curve shows the results corrected with the false match ratio derived from Monte Carlo simulation (N − pfN) detailed in Sect. 2.3. The growing deviation of the two curves is caused by the increase of false identifications at larger search radii. The curves nearly coincide up to 500 mas search radius, the value used in this case study, therefore the number of false optical-radio identifications is negligible.
Current usage metrics show cumulative count of Article Views (full-text article views including HTML views, PDF and ePub downloads, according to the available data) and Abstracts Views on Vision4Press platform.
Data correspond to usage on the plateform after 2015. The current usage metrics is available 48-96 hours after online publication and is updated daily on week days.
Initial download of the metrics may take a while.