Fig. 5
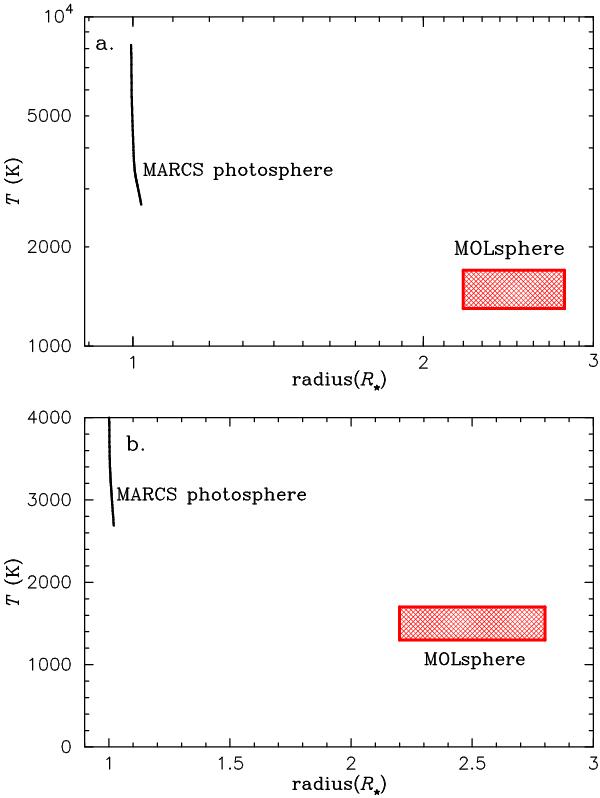
Temperature distribution as a function of radius predicted by the MARCS model for Aldebaran (black solid line) and the temperature of the MOLsphere derived from our modeling (red hatched rectangle). The panel a) shows the entire temperature range covered by the MARCS photosphere (note the logarithmic scale both for the temperature and radius), while the panel b) shows a lower temperature region including the upper photosphere and MOLsphere on the linear scale.
Current usage metrics show cumulative count of Article Views (full-text article views including HTML views, PDF and ePub downloads, according to the available data) and Abstracts Views on Vision4Press platform.
Data correspond to usage on the plateform after 2015. The current usage metrics is available 48-96 hours after online publication and is updated daily on week days.
Initial download of the metrics may take a while.