Fig. 4
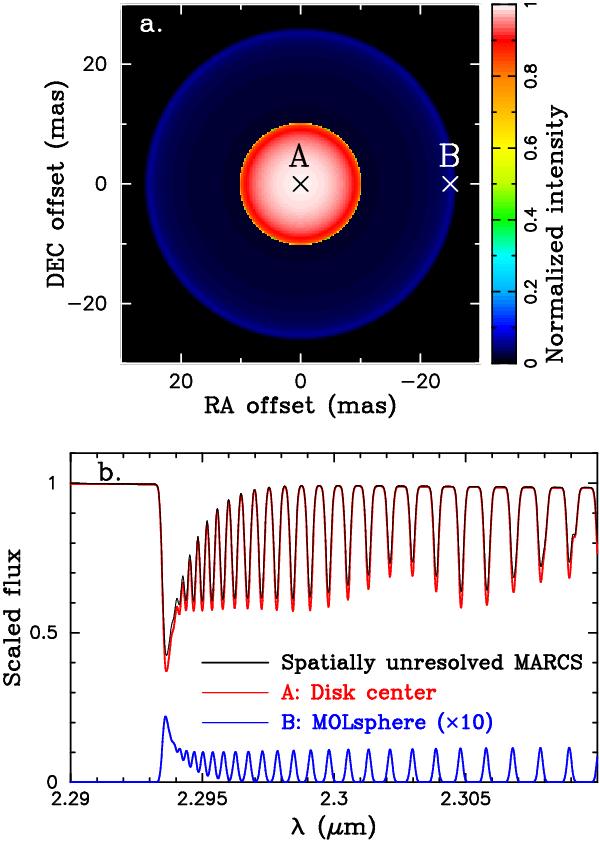
a) The image predicted at the CO band head by the MARCS+MOLsphere model shown in Fig. 3. b) Spatially resolved spectra at the center of the stellar disk (position A in the panel a) and at the edge of the MOLsphere (position B) are shown by the red and blue solid line, respectively. The spatially unresolved spectrum from the MARCS-only model is plotted by the black solid line. The spectrum at the edge of the MOLsphere is scaled up by a factor of 10.
Current usage metrics show cumulative count of Article Views (full-text article views including HTML views, PDF and ePub downloads, according to the available data) and Abstracts Views on Vision4Press platform.
Data correspond to usage on the plateform after 2015. The current usage metrics is available 48-96 hours after online publication and is updated daily on week days.
Initial download of the metrics may take a while.