Fig. 2
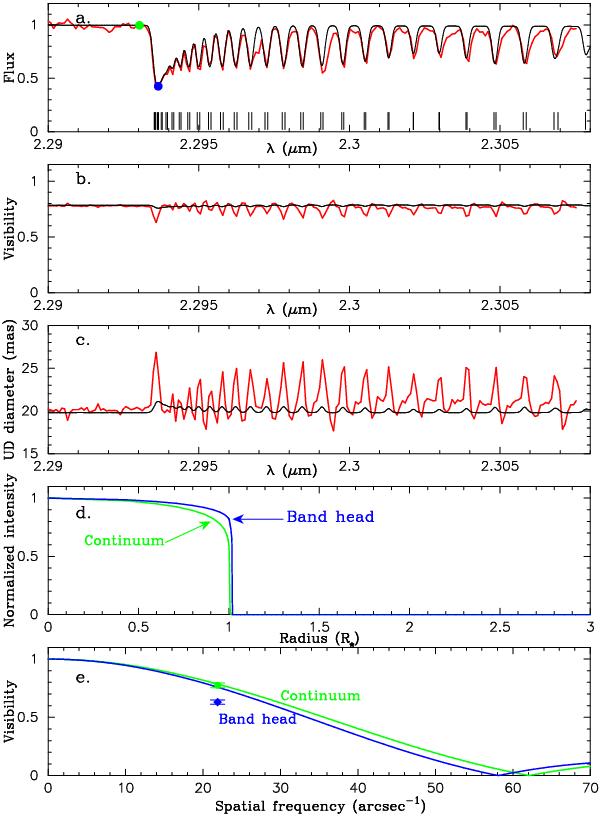
Comparison of the MARCS model with the AMBER data of Aldebaran. The parameters of the MARCS model are given in Sect. 4. a) Model spectrum (black solid line) computed from the pressure and temperature distributions of the MARCS model as described in Appendix A (not the pre-computed spectrum available on the MARCS website) with the observed spectrum (red solid line). The green and blue dots show the wavelengths of the intensity profiles and visibilities shown in the panels d) and e). The positions of the CO lines are marked by the ticks. b) Model visibility predicted at the 10.4 m baseline (black solid line) with the observed data (red solid line). c) Uniform-disk (UD) diameter derived from the MARCS model visibility shown in the panel b) (black solid line) with the one observed (red solid line). d) Model intensity profiles predicted in the continuum (green solid line) and in the CO band head (blue solid line), at the wavelengths marked in the panel a). e) Model visibilities as a function of spatial frequency predicted in the continuum (green solid line) and in the CO band head (blue solid line). The visibilities observed at these wavelengths are plotted by the dot (continuum) and the filled diamond (CO band head).
Current usage metrics show cumulative count of Article Views (full-text article views including HTML views, PDF and ePub downloads, according to the available data) and Abstracts Views on Vision4Press platform.
Data correspond to usage on the plateform after 2015. The current usage metrics is available 48-96 hours after online publication and is updated daily on week days.
Initial download of the metrics may take a while.