Fig. A.1
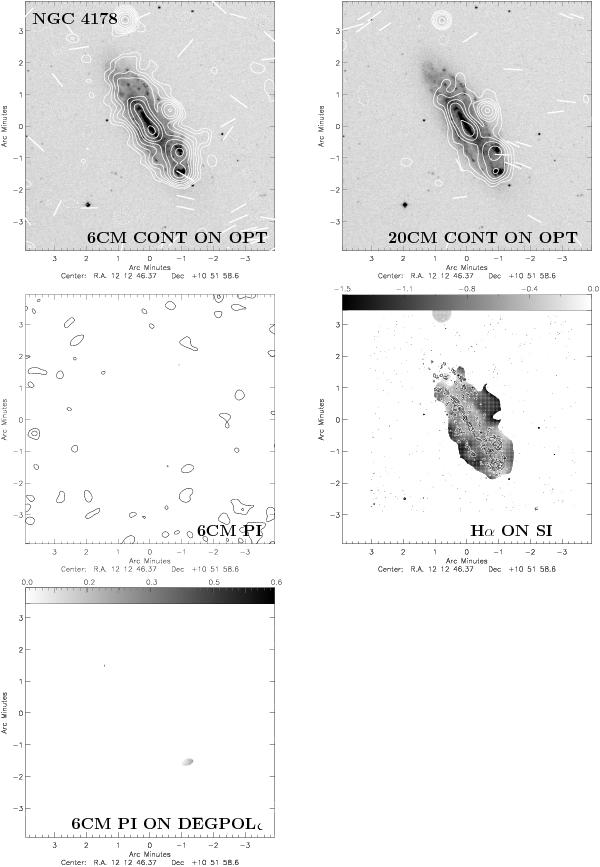
NGC 4178: from top left to bottom right: 6 cm total power emission distribution on DSS B band image together with the apparent B vectors, 20 cm total power emission distribution on DSS B band image together with the apparent B vectors, 6 cm polarized emission distribution, Goldmine Hα emission distribution on spectral index map, and 6 cm polarized emission distribution on degree of polarization. The sizes of the B vectors are proportional to the polarized intensity. Contour levels are ξ × (−3,3,5,8,12,20,30,50,80,120,200,300), with ξ = 12 μJy for the 6 cm total power emission, ξ = 80 μJy for the 20 cm total power emission, and ξ = 12 μJy for the 6 cm polarized emission.
Current usage metrics show cumulative count of Article Views (full-text article views including HTML views, PDF and ePub downloads, according to the available data) and Abstracts Views on Vision4Press platform.
Data correspond to usage on the plateform after 2015. The current usage metrics is available 48-96 hours after online publication and is updated daily on week days.
Initial download of the metrics may take a while.