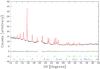
Fig. 6
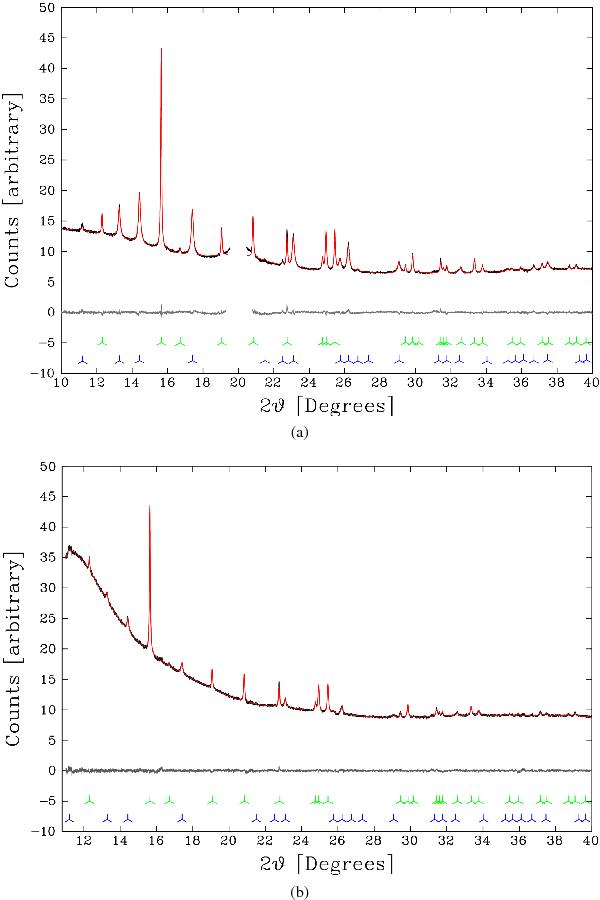
Sample rietveld refinements of powder patterns exhibiting vaterite and calcite peaks. The red curves show the fit, the grey curves show the difference curve and the markers indicate the positions of the individual vaterite (blue) and calcite (green) peaks. a) Initial sample exhibiting vaterite features in sapphire capillary. The sapphire capillary exhibits a strong peak at 19.97° 2θ which has been removed from the plot. b) Powder pattern exhibiting vaterite peaks at a CO2 pressure of 30 bar in quartz capillary.
Current usage metrics show cumulative count of Article Views (full-text article views including HTML views, PDF and ePub downloads, according to the available data) and Abstracts Views on Vision4Press platform.
Data correspond to usage on the plateform after 2015. The current usage metrics is available 48-96 hours after online publication and is updated daily on week days.
Initial download of the metrics may take a while.