Free Access
Fig. 4
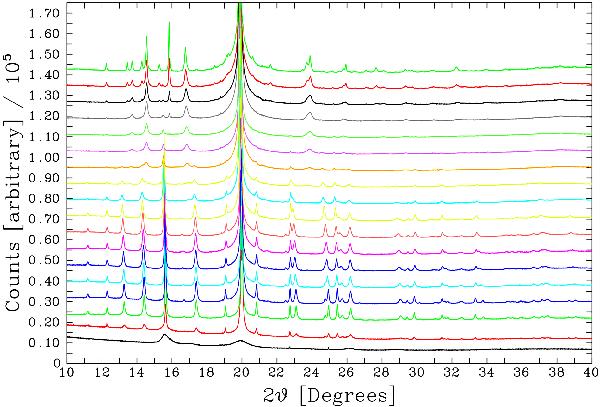
Thermal evolution of CaSiO3 exposed to CO2 at 6 bar whilst being heated from room temperature (bottom scan) to 1173 K (top scan). Patterns have been offset on the y-axis for clarity and temperature is increasing in steps of 50 K from bottom to top. The strong feature at 19.97 2θ is due to the sapphire tube.
Current usage metrics show cumulative count of Article Views (full-text article views including HTML views, PDF and ePub downloads, according to the available data) and Abstracts Views on Vision4Press platform.
Data correspond to usage on the plateform after 2015. The current usage metrics is available 48-96 hours after online publication and is updated daily on week days.
Initial download of the metrics may take a while.