Free Access
Fig. 3
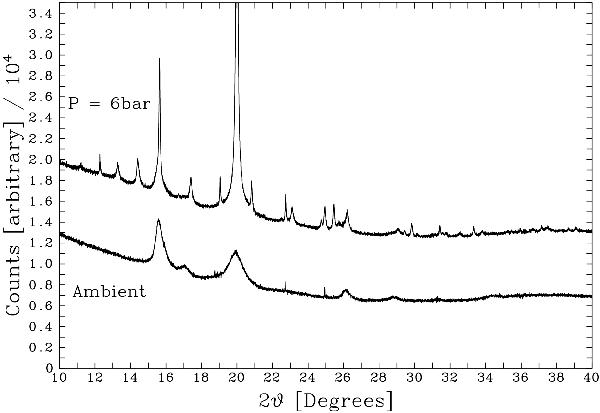
A comparison of the diffraction patterns for the powdered sample of CaSiO3 before (lower curve) and after (upper curve) the injection of CO2. The strong feature at 19.97° 2θ is due to the sapphire tube. Patterns are offset in the y-axis.
Current usage metrics show cumulative count of Article Views (full-text article views including HTML views, PDF and ePub downloads, according to the available data) and Abstracts Views on Vision4Press platform.
Data correspond to usage on the plateform after 2015. The current usage metrics is available 48-96 hours after online publication and is updated daily on week days.
Initial download of the metrics may take a while.