Fig. 3
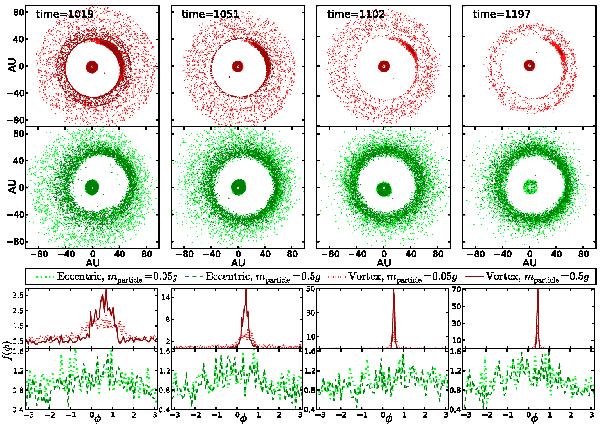
Dust distribution comparison at 1019, 1051, 1102, and 1197 orbits. We chose these snapshots because the vortex is located at the same azimuthal position of the eccentric feature which facilitates the comparison of the azimuthal particle concentration. The top and middle rows reflect the difference between the dust trapping in a vortex-holding disk and an eccentric disk. The light and dark colors represent the 0.05 g and 0.5 g particles. In the bottom panels, we plot the dust enhancement factor against azimuth at each corresponding snapshot.
Current usage metrics show cumulative count of Article Views (full-text article views including HTML views, PDF and ePub downloads, according to the available data) and Abstracts Views on Vision4Press platform.
Data correspond to usage on the plateform after 2015. The current usage metrics is available 48-96 hours after online publication and is updated daily on week days.
Initial download of the metrics may take a while.