Fig. 8
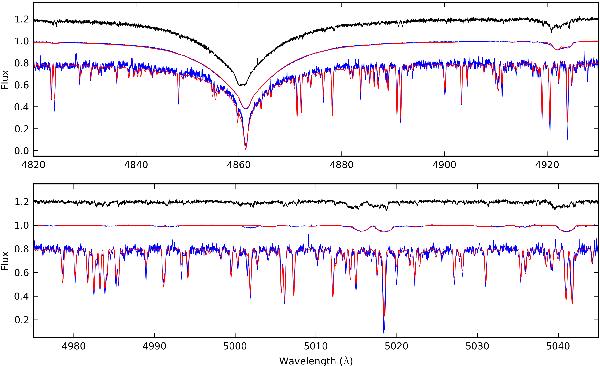
Comparison of normalised observed, disentangled and synthetic spectra in different wavelength regions for KIC 6352430. In each panel, the highest signal-to-noise HERMES spectrum is plotted with a black solid line shifted upwards by 0.2 flux units, the observed and synthetic spectra of the primary component are plotted with blue and red solid lines, respectively, and the observed and synthetic spectra of the secondary component are plotted in a similar manner, but shifted downwards by 0.2 flux units.
Current usage metrics show cumulative count of Article Views (full-text article views including HTML views, PDF and ePub downloads, according to the available data) and Abstracts Views on Vision4Press platform.
Data correspond to usage on the plateform after 2015. The current usage metrics is available 48-96 hours after online publication and is updated daily on week days.
Initial download of the metrics may take a while.