Fig. 5
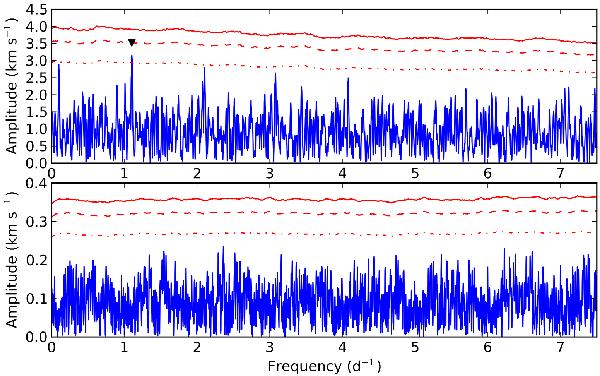
The Scargle periodogram of the O–C values of the primary (upper panel) and secondary component (lower panel) of KIC 4931738. The significance levels corresponding to a signal-to-noise ratio (calculated in a 3 d-1 window) of 4, 3.6, and 3 are plotted with red solid, dashed, and dot-dashed lines, respectively. The peak at 1.1040 ± 0.0006 d-1 is marked with a black triangle.
Current usage metrics show cumulative count of Article Views (full-text article views including HTML views, PDF and ePub downloads, according to the available data) and Abstracts Views on Vision4Press platform.
Data correspond to usage on the plateform after 2015. The current usage metrics is available 48-96 hours after online publication and is updated daily on week days.
Initial download of the metrics may take a while.