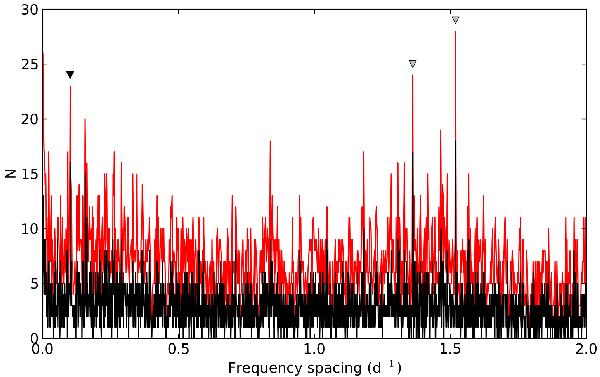
Fig. 22

Histogram of the distribution of frequency pairs between the 187 selected peaks in the frequency analysis of KIC 6352430 situated above 4 d-1. The histogram with a bin width of 2.5/T is plotted with red, while the histogram with a bin width of 1/T is plotted with a black solid line. The spacing δ2f is marked with a black triangle, while Δ1f and Δ2f are marked with grey triangles.
Current usage metrics show cumulative count of Article Views (full-text article views including HTML views, PDF and ePub downloads, according to the available data) and Abstracts Views on Vision4Press platform.
Data correspond to usage on the plateform after 2015. The current usage metrics is available 48-96 hours after online publication and is updated daily on week days.
Initial download of the metrics may take a while.


