Fig. 17
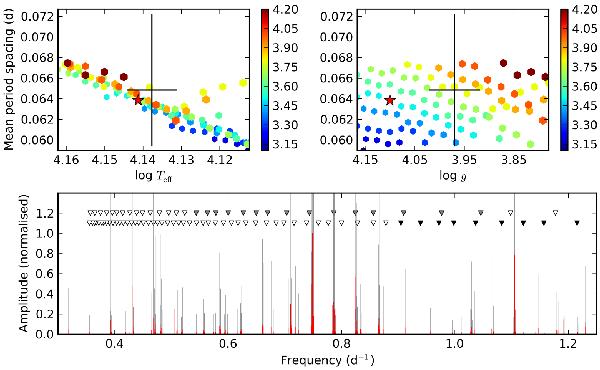
Mean period spacing of l = 1 modes (averaged over a wide range of radial orders) from models (Z = 0.01, αov = 0.2, X = 0.7) within 4σ of the derived fundamental parameters compared to the spacing values of the 4 strongest modes of KIC 4931738 around 0.75 d-1 plotted against Teff (upper left) and log g (upper right). The scatter in median spacing values around the diagonal in the first panel is caused by the shape of the period spacings (the number and depth of dips in the Δp(p) function). A black cross marks the observed mean spacing and the Teff and log g value determined from spectroscopy, with the extents denoting the spread in the measured spacing values and the estimated error in the observed fundamental parameters. Colour represents the mass in units of solar mass. (Lower panel ) The normalised selected peaks from the periodogram of KIC 4931738 are plotted in a similar manner to the one in Fig. 12, with the theoretical frequencies from a selected model (which is marked with a red asterisk on the upper panels) marked by triangles: l = 1 modes are plotted in the top row, while l = 2 modes are plotted in the bottom, and frequencies expected to be excited are marked by filled symbols.
Current usage metrics show cumulative count of Article Views (full-text article views including HTML views, PDF and ePub downloads, according to the available data) and Abstracts Views on Vision4Press platform.
Data correspond to usage on the plateform after 2015. The current usage metrics is available 48-96 hours after online publication and is updated daily on week days.
Initial download of the metrics may take a while.