Fig. 1
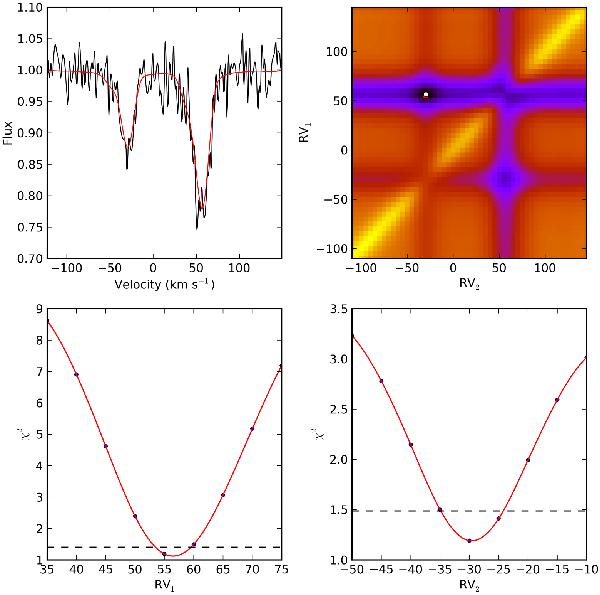
Visualisation of the radial velocity determination process for KIC 4931738. (Upper left) One normalised HERMES spectrum (solid black line) is shown around the Si ii line at 6347 Å with a synthetic binary spectrum (red solid curve) constructed using the determined radial velocities. (Upper right) The χ2-space resulting from a full 2D grid search of the radial velocities of the components. The lowest χ2 value is marked with a red filled circle while the accepted value from fitting the χ2 values in both dimensions across the best fit value is marked by a white filled circle (almost fully covering the underlying red one). These fits are shown in the (lower panels) with a red line, while the  level is plotted with a dashed line. RVi is expressed in km s-1.
Current usage metrics show cumulative count of Article Views (full-text article views including HTML views, PDF and ePub downloads, according to the available data) and Abstracts Views on Vision4Press platform.
Data correspond to usage on the plateform after 2015. The current usage metrics is available 48-96 hours after online publication and is updated daily on week days.
Initial download of the metrics may take a while.