Free Access
Fig. 2
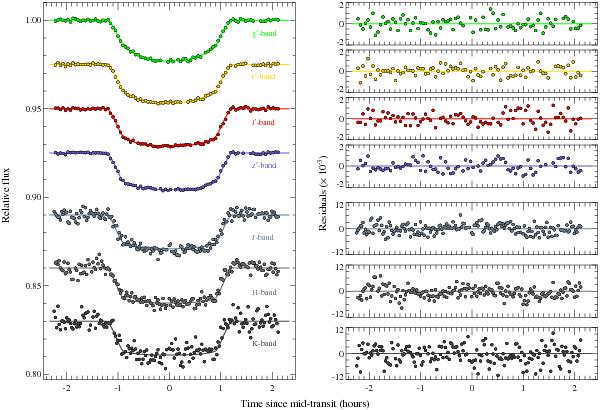
Left panel: detrended transit light curves (dots) of and the best-fit models (lines) for the WASP-23 GROND data. The optical photometry clearly exhibits a change in the shape of the transit due to the different limb-darkening in each band. Right panel: residuals of the light curve compared to the fitted models.
Current usage metrics show cumulative count of Article Views (full-text article views including HTML views, PDF and ePub downloads, according to the available data) and Abstracts Views on Vision4Press platform.
Data correspond to usage on the plateform after 2015. The current usage metrics is available 48-96 hours after online publication and is updated daily on week days.
Initial download of the metrics may take a while.