Fig. 6

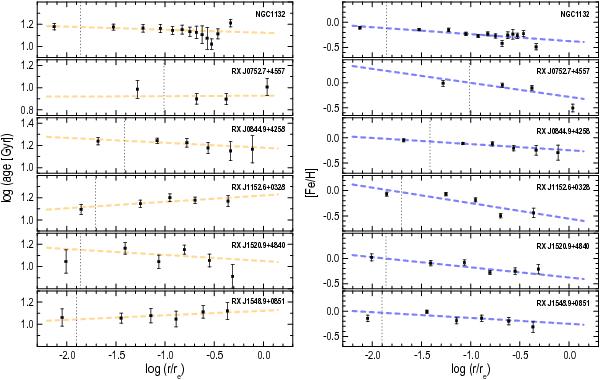
Radial gradients of age and metallicity for the observed FCGs. Left panels refer to age, right ones present metallicity. Dashed lines show the linear relations fit to the observed data. The ordinates are the decimal logarithm of age and the metallicity in dex. Each datapoint is the result of 200 Monte Carlo simulations and was averaged from both sides of the galaxy centre. Error bars are the corresponding standard deviations. Metallicity gradients are throughout negative (−0.31 ≤ ∇[Fe/H] ≤ −0.11) while age gradients are flat scattering around zero (−0.05 ≤ ∇age ≤ 0.06). Vertical lines indicate the seeing-dominated central parts.
Current usage metrics show cumulative count of Article Views (full-text article views including HTML views, PDF and ePub downloads, according to the available data) and Abstracts Views on Vision4Press platform.
Data correspond to usage on the plateform after 2015. The current usage metrics is available 48-96 hours after online publication and is updated daily on week days.
Initial download of the metrics may take a while.


