Fig. 7
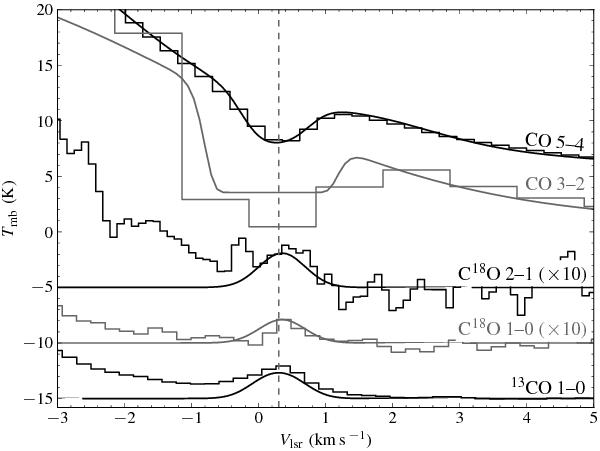
Zoom of the observed 0 km s-1 feature in various CO lines (histograms). The results from the radex slab are shown as solid lines. To improve visibility, the brightnesses for C18O (both observations and models) are multiplied by 10. Vertical offsets are applied as follows: +5 K for CO 5–4, −5 K for C18O 2–1, −10 K for C18O 1–0 and −15 K for 13CO 1–0. The gray dashed line marks the approximate centroid velocity of the absorption feature at + 0.2 km s-1. The model representations only include a component for the main envelope emission for 5–4 and 3–2, where a background is needed to absorb against. The 2–1 and 1–0 model lines only account for the foreground emission at ~0 km s-1, hence the discrepancies at Vlsr ≲ −1 km s-1 where the main envelope of AFGL 2591 dominates.
Current usage metrics show cumulative count of Article Views (full-text article views including HTML views, PDF and ePub downloads, according to the available data) and Abstracts Views on Vision4Press platform.
Data correspond to usage on the plateform after 2015. The current usage metrics is available 48-96 hours after online publication and is updated daily on week days.
Initial download of the metrics may take a while.