Fig. 6
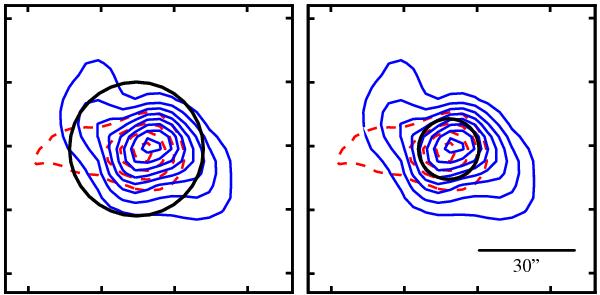
Indication of the half-power beam width of Herschel/HIFI, represented by black circles: 42′′ at 500 GHz (left) and 19′′ at 1100 GHz (right). The contour map represents HCO+ 4–3 emission toward AFGL 2591 measured by the HARP-B instrument at JCMT. The blue- and redshifted wings are shown in solid and dashed contours, respectively, and are defined as in Van der Wiel et al. (2011). The lowest contour and spacing between consecutive contours is 5 K km s-1 for both components.
Current usage metrics show cumulative count of Article Views (full-text article views including HTML views, PDF and ePub downloads, according to the available data) and Abstracts Views on Vision4Press platform.
Data correspond to usage on the plateform after 2015. The current usage metrics is available 48-96 hours after online publication and is updated daily on week days.
Initial download of the metrics may take a while.