Table 2
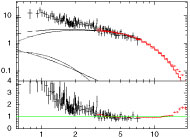
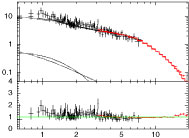
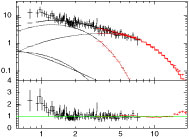
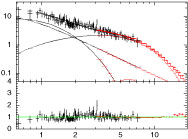
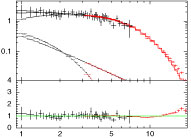
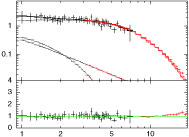
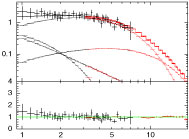
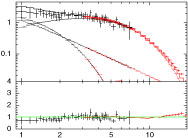
Fit results when attempting four different models (columns) to account for the soft excess on 2 data sets (rows).
| NS atmosphere model | Reflection model | Double black body | “fa” model |
|
|
|||
Time interval: 2–5 s ( with ν = 268 for black body fit) with ν = 268 for black body fit) |
|||
|
|
|||
 (ν = 268) (ν = 268) |
 (ν = 266) (ν = 266) |
 (ν = 266) (ν = 266) |
 (ν = 267) (ν = 267) |
| L/LEdd = 0.501 ± 0.004 | log ξ = 3.60 ± 0.03 | kT1 = 0.620 ± 0.017 | kT = 1.985 ± 0.009 |
| R = 16.49 ± 0.09 km | kT = 2.27 ± 0.03 | F1 = 18% | Fbb = 63% |
| R = 10.0 ± 12.8 | kT2 = 2.082 ± 0.013 | fa = 16.6 ± 0.6 | |
| (nH = 1020 cm-3) | F2 = 82% | Ffa = 37% | |
|
|
|
|
|
|
|||
Time interval: 12–16 s ( with ν = 148 for black body fit) with ν = 148 for black body fit) |
|||
|
|
|||
 (ν = 148) (ν = 148) |
 (ν = 146) (ν = 146) |
 (ν = 146) (ν = 146) |
 (ν = 147) (ν = 147) |
| L/LEdd = 0.293 ± 0.002 | log ξ = 3.61 ± 0.14 | kT1 = 1.593 ± 0.046 | kT = 1.790 ± 0.007 |
| R = 13.76 ± 0.08 km | kT = 1.84 ± 0.02 | F1 = 73% | Fbb = 80% |
| R = 0.38 ± 0.24 | kT2 = 2.82 ± 0.34 | fa = 3.7 ± 0.3 | |
| (nH = 1020 cm-3) | F2 = 27% | Ffa = 20% | |
|
|
|
|
Notes. First order LETGS spectra were combined and binned to 15 photons per bin. The figures show the deconvolved spectra (top panels; in units of phot cm-2 s-1 keV-1) and their relative deviation (i.e., data divided by the predicted model value; bottom panels) with respect to the models. Black curves are for LETGS and red for RXTE data. The y-axes for the bottom panels have identical scales. (Color version of table available in online version.)
Current usage metrics show cumulative count of Article Views (full-text article views including HTML views, PDF and ePub downloads, according to the available data) and Abstracts Views on Vision4Press platform.
Data correspond to usage on the plateform after 2015. The current usage metrics is available 48-96 hours after online publication and is updated daily on week days.
Initial download of the metrics may take a while.