Free Access
Fig. 9
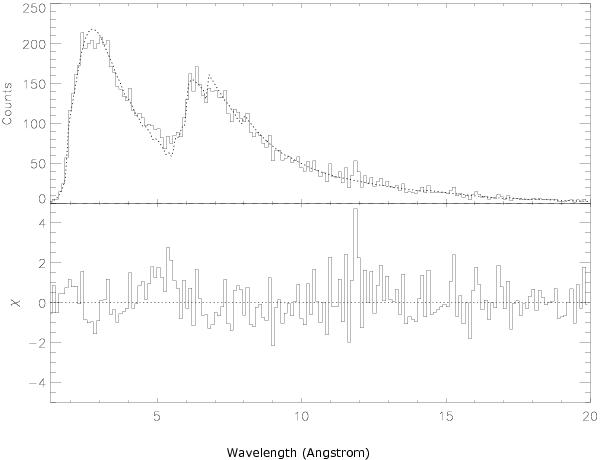
Chandra-LETGS burst spectrum between 0 and 7 s after burst onset, in wavelength domain. The histogram represents the data and the dotted line a continuum fit. Top panel is the spectrum, bottom panel the deviation with respect to the fitted model in units of σ. Note the feature at 11.9 Å.
Current usage metrics show cumulative count of Article Views (full-text article views including HTML views, PDF and ePub downloads, according to the available data) and Abstracts Views on Vision4Press platform.
Data correspond to usage on the plateform after 2015. The current usage metrics is available 48-96 hours after online publication and is updated daily on week days.
Initial download of the metrics may take a while.