Fig. 6
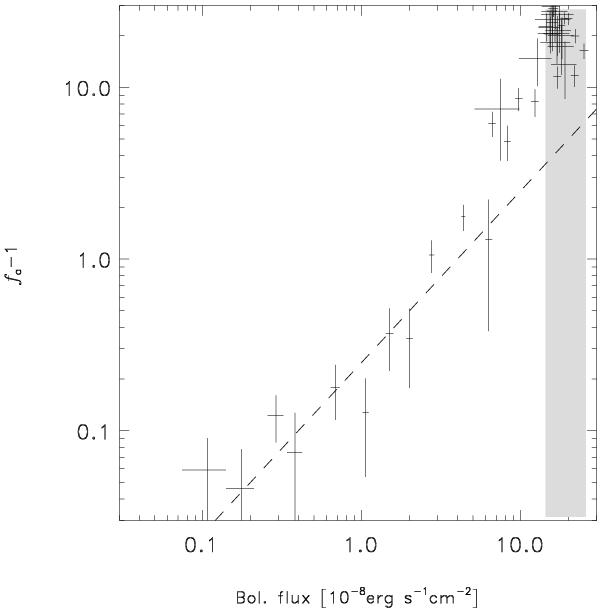
Persistent emission flux pre-factor fa minus 1 versus bolometric burst flux measurements (see also Fig. 5). The gray area indicates the region of the Eddington limit, between that for a hydrogen and a helium photosphere. The dashed line shows how the trend should go if the flux ratio of the increased persistent spectrum to burst would be constant.
Current usage metrics show cumulative count of Article Views (full-text article views including HTML views, PDF and ePub downloads, according to the available data) and Abstracts Views on Vision4Press platform.
Data correspond to usage on the plateform after 2015. The current usage metrics is available 48-96 hours after online publication and is updated daily on week days.
Initial download of the metrics may take a while.