Fig. 4
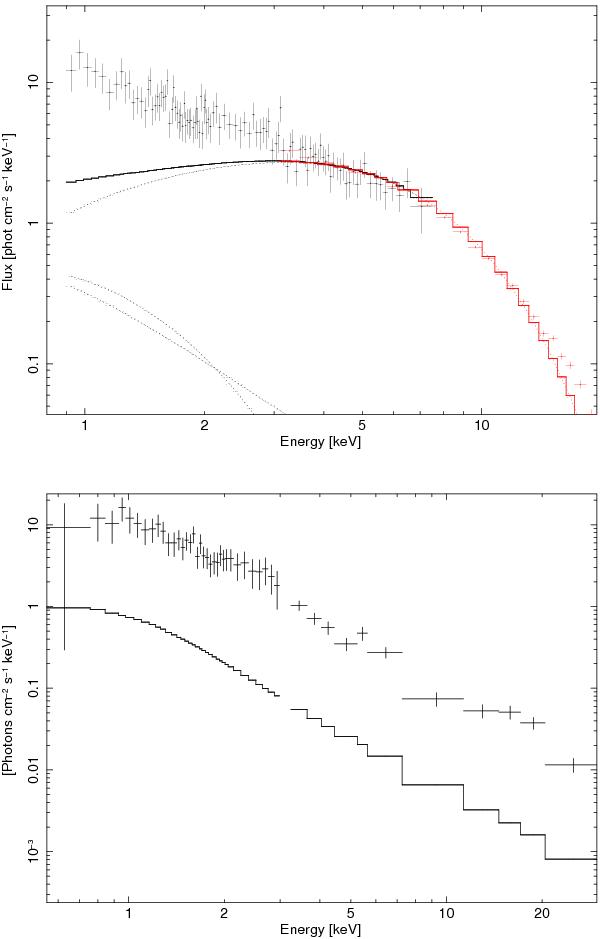
Deconvolved spectra for 2 to 5 s after burst onset. The top panel shows the Chandra (black) and RXTE (red) spectrum. Data points are indicated by crosses and the total model by the histogram. The upper dotted curve represents the black body component and the lower two curved lines comprise the model components for the pre-burst radiation. The model is a bad fit ( for ν = 268), but can be made consistent with the data by leaving free the normalization fa of the non-burst model (
 for ν = 267). In the bottom panel the residual spectrum is plotted after subtraction of the fitted black body model (crosses). The model for the non-burst spectrum is plotted as a histogram. For clarity Chandra data is plotted up to 3 keV and RXTE data beyond 3 keV (only PCU2 to extend the energy range from 20 to 30 keV for visualization purposes). (Color version of figure available in online version.)
Current usage metrics show cumulative count of Article Views (full-text article views including HTML views, PDF and ePub downloads, according to the available data) and Abstracts Views on Vision4Press platform.
Data correspond to usage on the plateform after 2015. The current usage metrics is available 48-96 hours after online publication and is updated daily on week days.
Initial download of the metrics may take a while.