Fig. 10
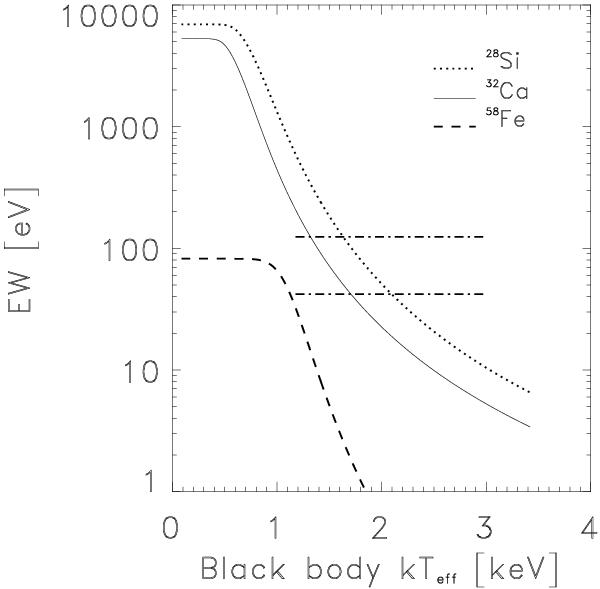
For the 20 s exposure (see Figs. 7 and 8), this graph shows the upper limits of an absorption edge at 2.67 keV (lower horizontal dash-dotted line) and 3.48 keV (upper horizontal line), compared to the predictions for the K-edge of hydrogen-like 28Si (dotted curve), 32Ca (solid curve) and 56Fe (dashed curve), for abundances as determined from the He0.1 model (pure helium ignition at 0.1 ṀEdd) in Weinberg et al. (2006). The range where the upper limits apply are set by the range of black body color temperatures measured (2–3 keV) multiplied with a maximum possible color correction of 0.6 to arrive at effective temperatures (e.g., Suleimanov et al. 2011). The upper limits would be 3 to 4 times better if the edge energy would be gravitationally redshifted by a factor of 1.31. They are 4.5 times worse for an exposure time of 1 s.
Current usage metrics show cumulative count of Article Views (full-text article views including HTML views, PDF and ePub downloads, according to the available data) and Abstracts Views on Vision4Press platform.
Data correspond to usage on the plateform after 2015. The current usage metrics is available 48-96 hours after online publication and is updated daily on week days.
Initial download of the metrics may take a while.