Fig. 1
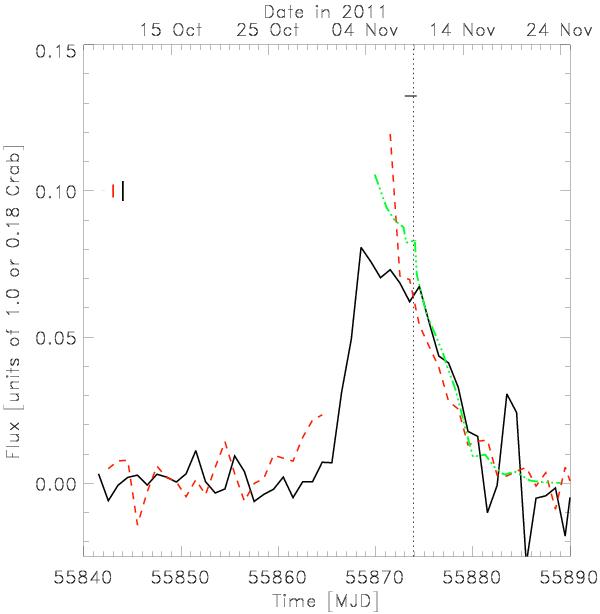
Light curves of the 2011 outburst of SAX J1808.4 − 3658: from 2–10 keV RXTE/PCA data (green dash-dotted line, normalized to 1580.5 c s-1 PCU-1 equivalent to 1.0 Crab unit; see also Patruno et al. 2012), 2–10 keV MAXI/GSC data (red dashed line; normalized to 3.2 c s-1 cm-2 equivalent to 1.0 Crab unit) and 15–50 keV Swift/BAT data (black solid line; normalized to 0.22 c s-1 cm-2 equivalent to 0.18 Crab units). The outburst started on MJD 55 865 (Oct. 31st) and lasted for 21 d, until MJD 55886. The horizontal solid line indicates the time frame of the Chandra observation and the vertical dotted line through it the burst that was detected with Chandra and RXTE. The vertical bars at mid left indicate the typical 1σ uncertainty per data set (PCA flux errors are typically smaller than the line thickness). (Color version of figure available in online version.)
Current usage metrics show cumulative count of Article Views (full-text article views including HTML views, PDF and ePub downloads, according to the available data) and Abstracts Views on Vision4Press platform.
Data correspond to usage on the plateform after 2015. The current usage metrics is available 48-96 hours after online publication and is updated daily on week days.
Initial download of the metrics may take a while.