Free Access
Fig. 9
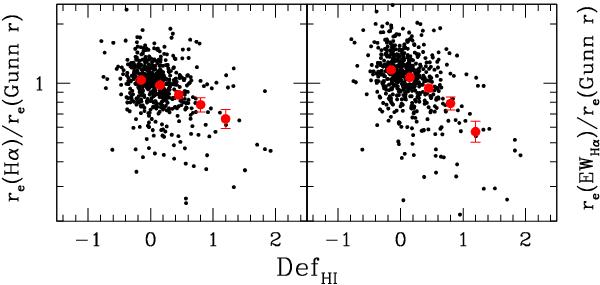
Ratio between effective radii (left) and the EW/r parameter (right) as a function of the HI-deficiency. Big red dots are the average values along the y-axis in different bins of HI deficiency. The 1σ error bar is from bootstrap resampling.
Current usage metrics show cumulative count of Article Views (full-text article views including HTML views, PDF and ePub downloads, according to the available data) and Abstracts Views on Vision4Press platform.
Data correspond to usage on the plateform after 2015. The current usage metrics is available 48-96 hours after online publication and is updated daily on week days.
Initial download of the metrics may take a while.