Fig. 6
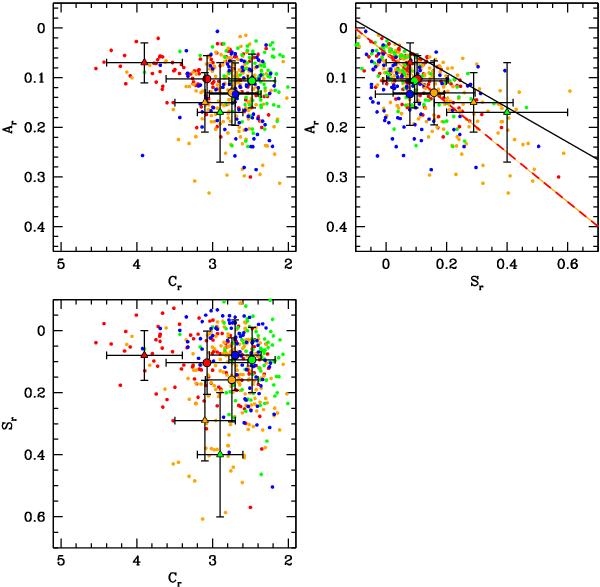
Galaxy distribution (with inclinations lower than 66.5° on the sky) in the space of CAS parameters measured in the r band. The solid black line is the best fit of Conselice’s (2003) data and the red-orange line is the best fit of our data restricted to the spirals (Sa-Sd) to be consistent with the Frei et al. (1996) selection used by Conselice. Points are color–coded according to the morphological type: red for Sa-Sb, orange for Sc-Sd, green for Sdm-Im, and blue for the BCDs. The black contoured round points are the average values for each group of morphological type, and the black contoured triangles are the average values given by Conselice (2003) for the same group of types. Error bars mark the 1σ standard deviation.
Current usage metrics show cumulative count of Article Views (full-text article views including HTML views, PDF and ePub downloads, according to the available data) and Abstracts Views on Vision4Press platform.
Data correspond to usage on the plateform after 2015. The current usage metrics is available 48-96 hours after online publication and is updated daily on week days.
Initial download of the metrics may take a while.