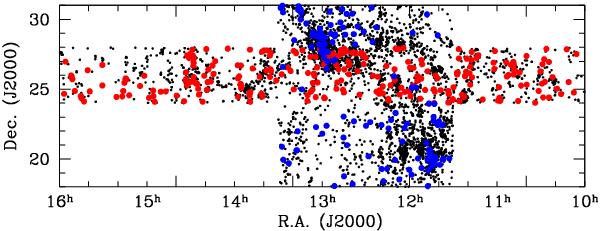
Fig. 2

Sky distribution (RA and Dec not in scale) of the Coma supercluster galaxies. Black dots represent the optically selected galaxies (all types) selected from the SDSS database (11h30m < RA < 13h30m, region 1) or from ALFALFA in the strip between 24° < Dec < 28° beyond the previous RA window (region 2). Red dots refer to the 261 galaxies observed in Hα3 in the ALFALFA strip. The 139 optically selected CGCG galaxies followed-up in Hα outside the ALFALFA strip and 16 in the ALFALFA strip are shown as blue dots.
Current usage metrics show cumulative count of Article Views (full-text article views including HTML views, PDF and ePub downloads, according to the available data) and Abstracts Views on Vision4Press platform.
Data correspond to usage on the plateform after 2015. The current usage metrics is available 48-96 hours after online publication and is updated daily on week days.
Initial download of the metrics may take a while.


