Fig. 11
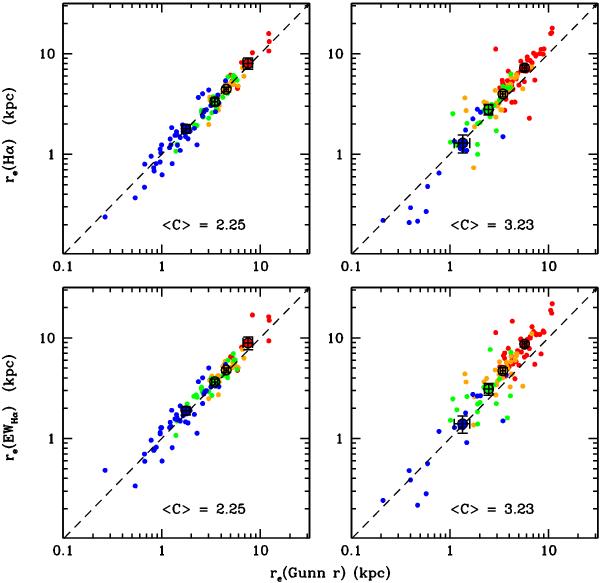
Top panels: relation between half-light radii of the Hα emission and those of the stellar continuum radiation in the lowest and highest quartiles of the r-band concentration index for unperturbed galaxies. Bottom panels: the same, but using the half-light radii of the EWHα (EW/r parameter). Points are color-coded in quartiles of stellar mass: red for log (M∗/M⊙) ≥ 10.3, orange for 9.8 ≤ log (M∗/M⊙) < 10.3, green for 9.3 ≤ log (M∗/M⊙) < 9.8, and blue for log (M∗/M⊙) < 9.3. The black-contoured big points are the average ratios for each bin of stellar mass.
Current usage metrics show cumulative count of Article Views (full-text article views including HTML views, PDF and ePub downloads, according to the available data) and Abstracts Views on Vision4Press platform.
Data correspond to usage on the plateform after 2015. The current usage metrics is available 48-96 hours after online publication and is updated daily on week days.
Initial download of the metrics may take a while.