Fig. 10
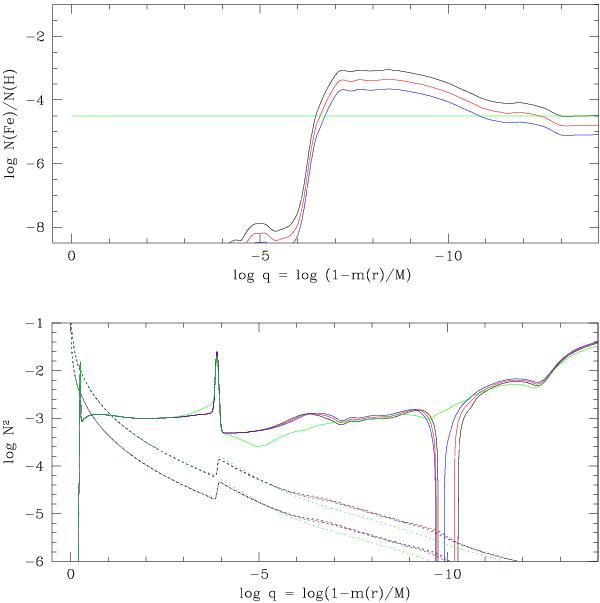
Upper panel: iron abundance profiles used in four, otherwise identical, test models. The black, red, blue, and green curves correspond to the profile at diffusive equilibrium between gravitational settling and radiative levitation, the profile when the amount of levitating iron is decreased by a factor of two, the profile after a decrease of a factor of four, and the profile assuming a uniform iron distribution in solar proportion. Lower panel: corresponding profiles for the Brunt-Väisälä (solid curves) and Lamb (dotted curves for l = 1 and l = 2) frequencies.
Current usage metrics show cumulative count of Article Views (full-text article views including HTML views, PDF and ePub downloads, according to the available data) and Abstracts Views on Vision4Press platform.
Data correspond to usage on the plateform after 2015. The current usage metrics is available 48-96 hours after online publication and is updated daily on week days.
Initial download of the metrics may take a while.