Fig. 1
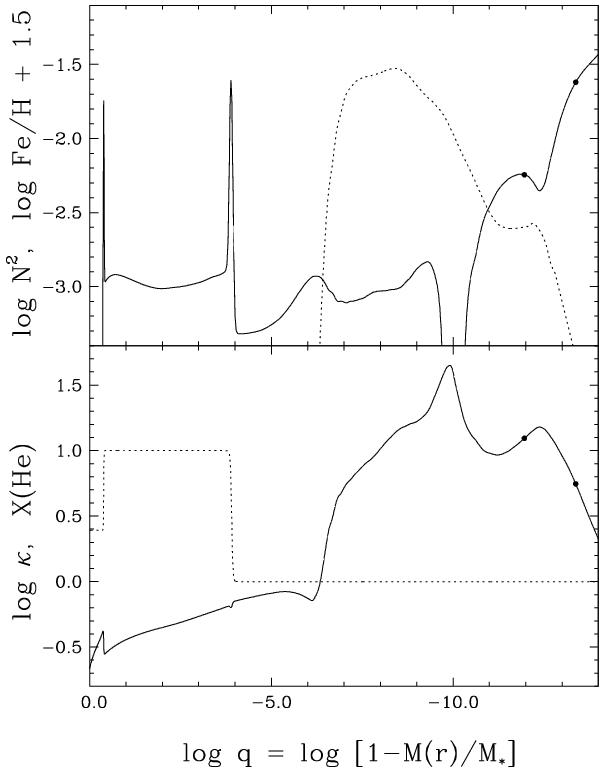
Some structural properties for a representative 3G model. Upper panel: run of the logarithm of the square of the Brunt-Väisälä frequency as a function of fractional mass depth (solid curve) and equilibrium abundance profile of Fe (dotted curve, shifted upward by 1.5 dex). The solar ratio is log Fe/H = −4.5 ( − 3.0 on the shifted scale). Lower panel: run of the logarithm of the opacity as a function of depth (solid curve), and profile of the He distribution (dotted curve). In both panels the locations of the atmospheric layers, defined as those with an optical depth between log τ = 1.0 and log τ = −1.0, are indicated by dots.
Current usage metrics show cumulative count of Article Views (full-text article views including HTML views, PDF and ePub downloads, according to the available data) and Abstracts Views on Vision4Press platform.
Data correspond to usage on the plateform after 2015. The current usage metrics is available 48-96 hours after online publication and is updated daily on week days.
Initial download of the metrics may take a while.