Fig. 3
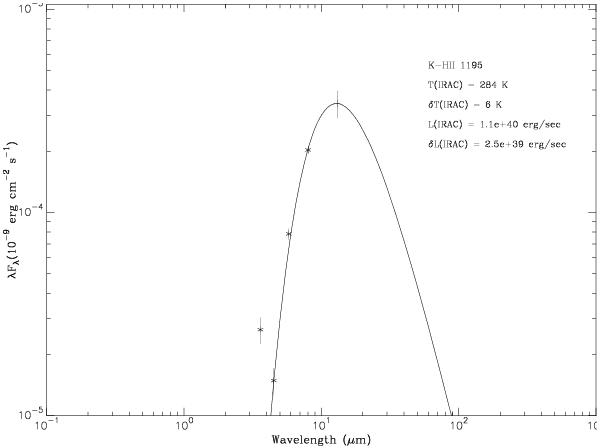
a) The IRAC fluxes of a representative HII region (K-HII 1195) for the four bands, with a best black body fit to the three longer wavelength bands. The point at the maximum of the curve is not an observed flux, but the estimated peak flux with its error bar. Also the 3.6 μm flux shows a marked excess over the black body curve.
Current usage metrics show cumulative count of Article Views (full-text article views including HTML views, PDF and ePub downloads, according to the available data) and Abstracts Views on Vision4Press platform.
Data correspond to usage on the plateform after 2015. The current usage metrics is available 48-96 hours after online publication and is updated daily on week days.
Initial download of the metrics may take a while.