Fig. 6
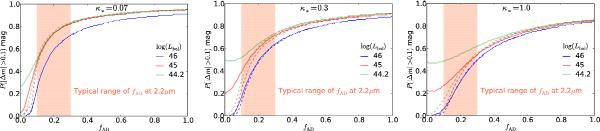
Probability to observe microlensing (de)magnification |Δm| > 0.1 mag as a function of the fraction of the flux fAD originating from the accretion disc. The solid line is for a compact model for the torus and the dashed line for an extended model. The blue, red and green curves correspond to different source bolometric luminosities. Panels from left to right correspond to κ∗ = 0.07, κ∗ = 0.3, κ∗ = 1.0. Probabilities are calculated for λrest = 2.2 μm.
Current usage metrics show cumulative count of Article Views (full-text article views including HTML views, PDF and ePub downloads, according to the available data) and Abstracts Views on Vision4Press platform.
Data correspond to usage on the plateform after 2015. The current usage metrics is available 48-96 hours after online publication and is updated daily on week days.
Initial download of the metrics may take a while.