Free Access
Fig. 2
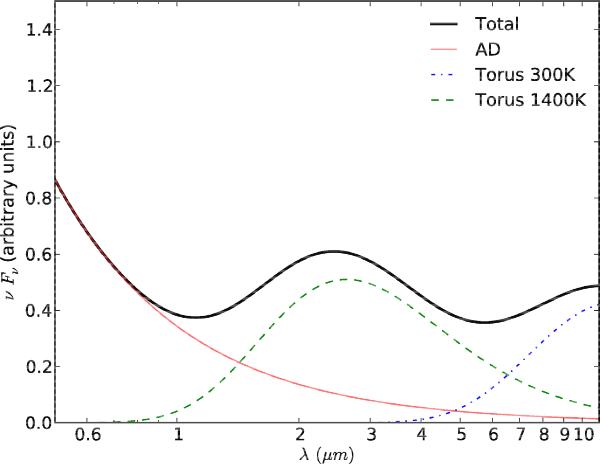
Spectral energy distribution of our source model between 0.5 and 11 μm (rest-frame). The accretion disc (AD) emission is shown with a solid red line, the “hot” component of the torus with a dashed green line, the “cold” component with dashed-dotted blue line and the total SED with thick black line.
Current usage metrics show cumulative count of Article Views (full-text article views including HTML views, PDF and ePub downloads, according to the available data) and Abstracts Views on Vision4Press platform.
Data correspond to usage on the plateform after 2015. The current usage metrics is available 48-96 hours after online publication and is updated daily on week days.
Initial download of the metrics may take a while.