Fig. A.1
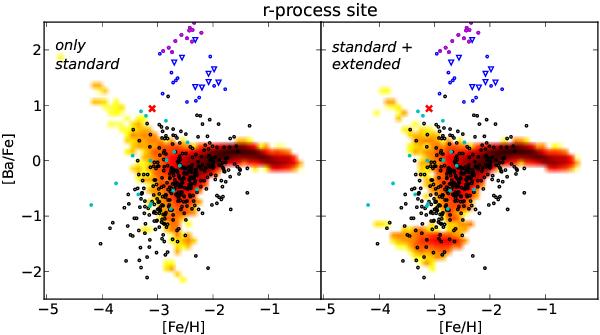
[Ba/Fe] vs. [Fe/H] results; on the left the model for an r-process contribution only from the “standard” site, on the right the r-model, where both “standard” and “extended” contributions are considered. The density plot is the distribution of simulated long-living stars for our models; the density is on a log scale, normalized to the peak of the distribution (see bar over the Fig. 2 for the color scale). Superimposed, we show the abundances ratios for halo stars (data from Frebel 2010). The symbols are the same as in Fig. 3.
Current usage metrics show cumulative count of Article Views (full-text article views including HTML views, PDF and ePub downloads, according to the available data) and Abstracts Views on Vision4Press platform.
Data correspond to usage on the plateform after 2015. The current usage metrics is available 48-96 hours after online publication and is updated daily on week days.
Initial download of the metrics may take a while.