Fig. 6
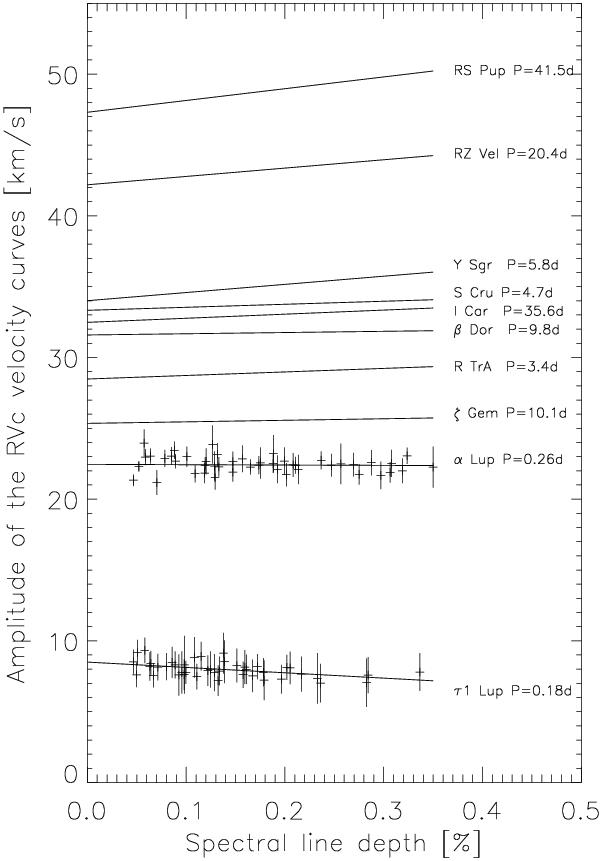
Amplitude of the RVc curves as a function of the spectral line depth in the case of the β Cephei stars α Lup and τ1 Lup (dots are the HARPS measurements presented in this paper with the corresponding uncertainties) and for the eight Cepheids studied in Nardetto et al. (2007).
Current usage metrics show cumulative count of Article Views (full-text article views including HTML views, PDF and ePub downloads, according to the available data) and Abstracts Views on Vision4Press platform.
Data correspond to usage on the plateform after 2015. The current usage metrics is available 48-96 hours after online publication and is updated daily on week days.
Initial download of the metrics may take a while.