Free Access
Fig. 1
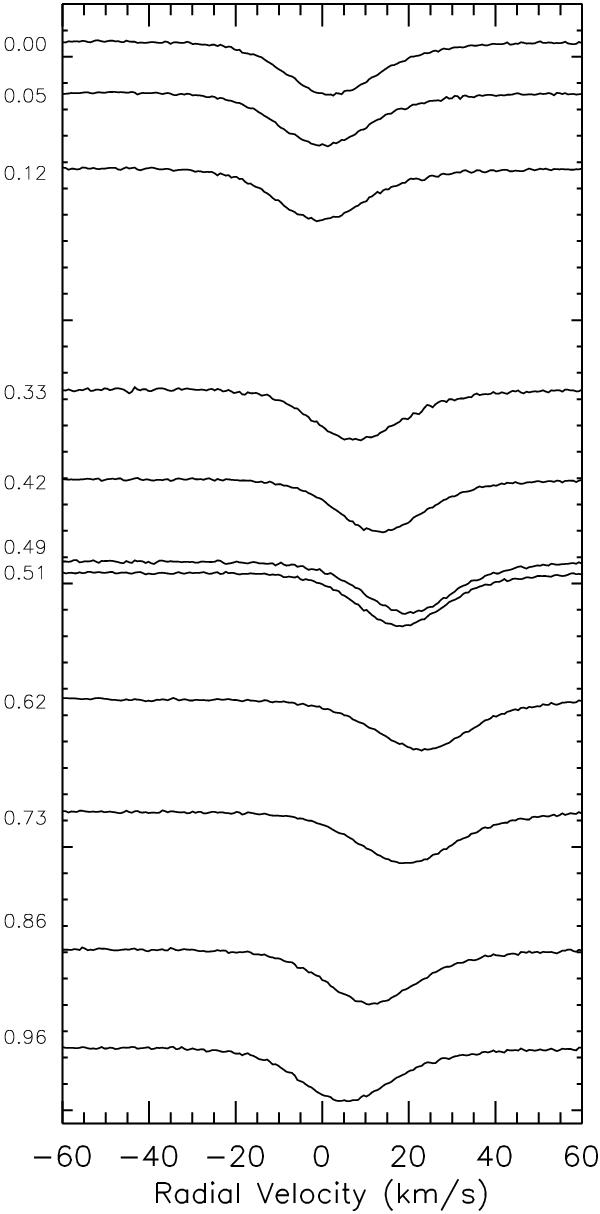
O ii 4705.3 Å (D ≃ 17%) spectral line evolution for α Lup. Pulsation phases are given on the left of each profile. Wavelengths have been translated into velocities (positive velocities correspond to a redshift or receding motion).
Current usage metrics show cumulative count of Article Views (full-text article views including HTML views, PDF and ePub downloads, according to the available data) and Abstracts Views on Vision4Press platform.
Data correspond to usage on the plateform after 2015. The current usage metrics is available 48-96 hours after online publication and is updated daily on week days.
Initial download of the metrics may take a while.