Free Access
Fig. 6
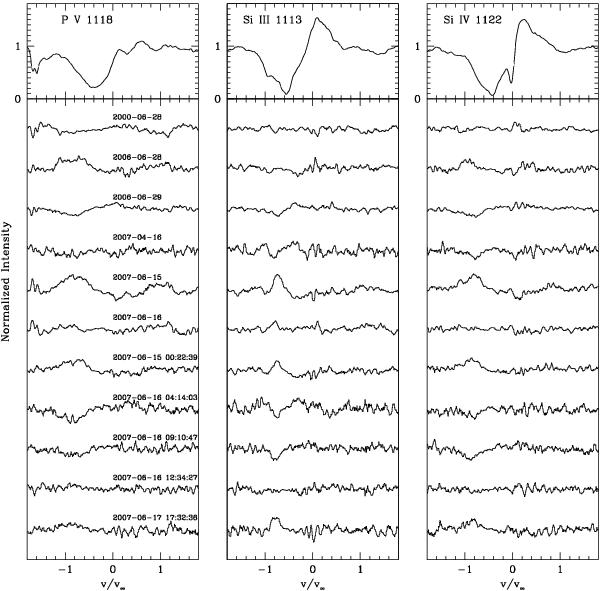
Top-panels: averaged P v λ1118 (left), Si iii λ1113 (center), and Si iv λ1122 (right) P Cygni profiles of Hen 2-131. (Bottom-panels: normalized differences between individual spectra and the corresponding averaged spectrum shown in the top-panel. The epoch of each observation is indicated on the P v spectra.
Current usage metrics show cumulative count of Article Views (full-text article views including HTML views, PDF and ePub downloads, according to the available data) and Abstracts Views on Vision4Press platform.
Data correspond to usage on the plateform after 2015. The current usage metrics is available 48-96 hours after online publication and is updated daily on week days.
Initial download of the metrics may take a while.