Fig. 5
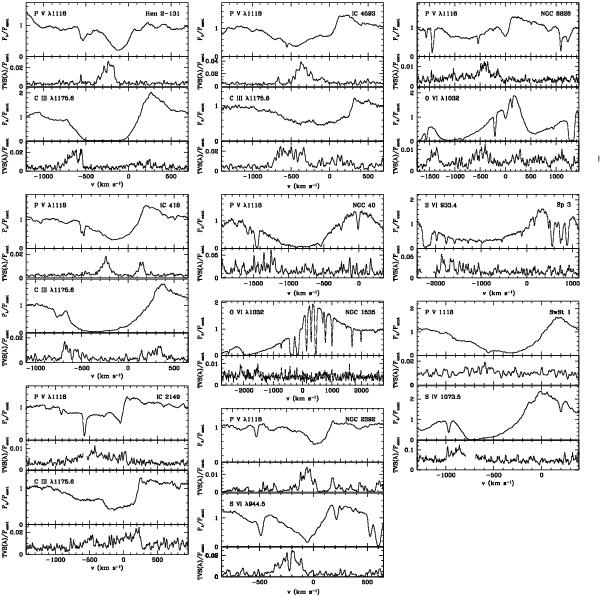
Selected P Cygni profiles of the CSPNe showing FUSE variability. For each line, the top panel shows the averaged spectrum and the lower panel the temporal variation spectrum, TVS; both are normalized by the continuum level at the spectral range of the line. Note that we have omitted the TVS at specific wavelength ranges where the continuum level of the averaged spectrum falls to zero, either in the trough of some lines (e.g., the S vi λ933.4 Å line of Sp 3) or at the location of narrow, deep absorption lines (e.g., the P v λ1118 Å line of IC 2149).
Current usage metrics show cumulative count of Article Views (full-text article views including HTML views, PDF and ePub downloads, according to the available data) and Abstracts Views on Vision4Press platform.
Data correspond to usage on the plateform after 2015. The current usage metrics is available 48-96 hours after online publication and is updated daily on week days.
Initial download of the metrics may take a while.