Free Access
Fig. 2
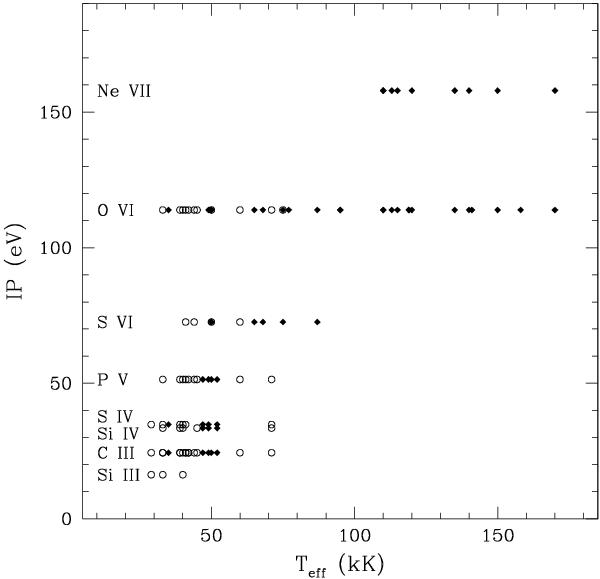
Ionization potential of the lines with P Cygni profiles seen in the FUSE spectrum of a CSPN vs. its effective temperature. Objects that show line variability are shown as open circles and those that do not display variability as filled diamonds.
Current usage metrics show cumulative count of Article Views (full-text article views including HTML views, PDF and ePub downloads, according to the available data) and Abstracts Views on Vision4Press platform.
Data correspond to usage on the plateform after 2015. The current usage metrics is available 48-96 hours after online publication and is updated daily on week days.
Initial download of the metrics may take a while.