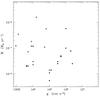
Fig. 16
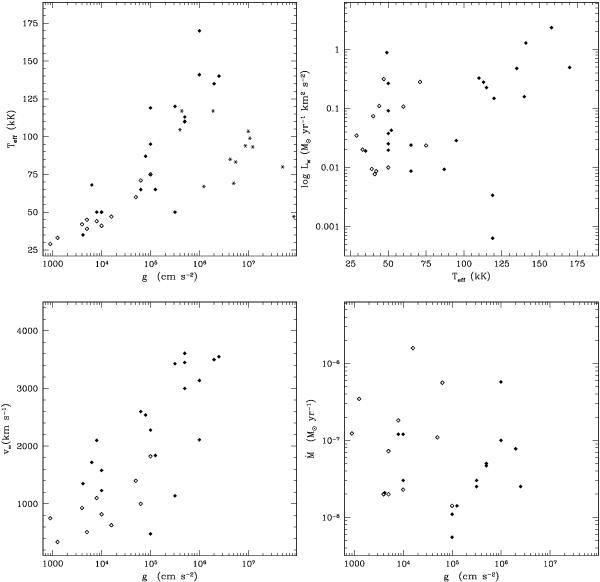
Distributions of the CSPNe with P Cygni profile in FUSE spectra in the Teff − log g (top-left), Lwind − Teff (top-right), v∞ − log g (bottom-left), and log Ṁ − log g (bottom-right) diagrams. The CSPNe with variable P Cygni profiles are shown with open diamonds, while those without variable P Cygni profiles are shown with filled diamonds. In addition, the Teff − log g diagram (top-left) shows the location of the CSPNe without P Cygni profiles (stars).
Current usage metrics show cumulative count of Article Views (full-text article views including HTML views, PDF and ePub downloads, according to the available data) and Abstracts Views on Vision4Press platform.
Data correspond to usage on the plateform after 2015. The current usage metrics is available 48-96 hours after online publication and is updated daily on week days.
Initial download of the metrics may take a while.