Fig. 6
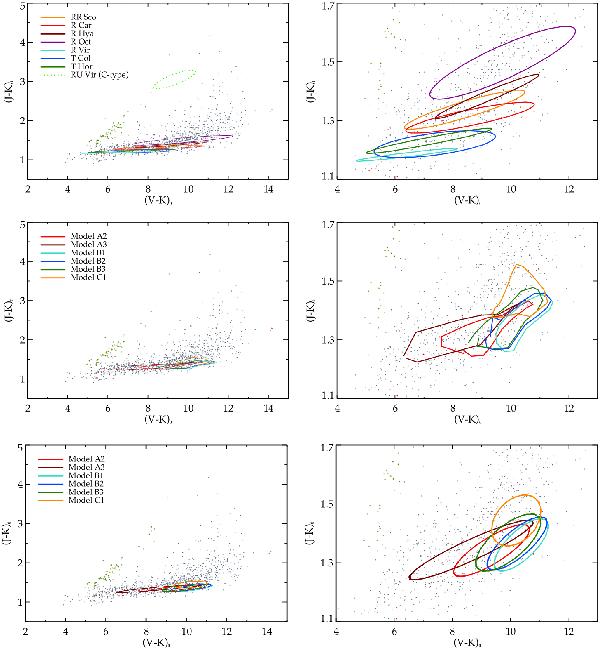
Observed and synthetic photometric variations of M-type Miras (and one C-type Mira RU Vir, which is included for illustration purposes). Top panels: photometric variations for the sample of observed targets, derived from sine fits of light-curves (see text in Sect. 5 for details). Middle panels: photometric variations for the dynamical models in set D. Bottom panels: photometric variations for the dynamical models in set D, with colors calculated from sine fits of the light-curves, same as for the observational data in the top panels. The right panels show the same content, zoomed in and centered on the color loops. For comparison, we also show the observational data of Fig. 4.
Current usage metrics show cumulative count of Article Views (full-text article views including HTML views, PDF and ePub downloads, according to the available data) and Abstracts Views on Vision4Press platform.
Data correspond to usage on the plateform after 2015. The current usage metrics is available 48-96 hours after online publication and is updated daily on week days.
Initial download of the metrics may take a while.