Fig. 11
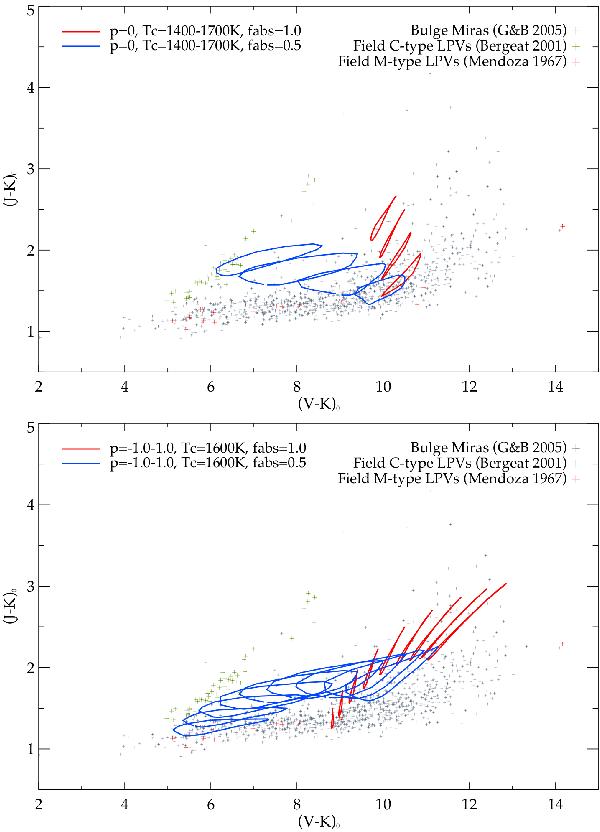
Photometric variations for models in set P, with fabs = 1.0 (red) and fabs = 0.5 (blue). Top panel: models with p = 0 (grey dust) and Tc = 1400−1700 K. The higher the condensation temperature the further the color loops are from the bottom right corner. Bottom panel: models with Tc = 1600 K and p varying between [−1.0,1.0]. The higher the p-value the further the loops are from the bottom left corner.
Current usage metrics show cumulative count of Article Views (full-text article views including HTML views, PDF and ePub downloads, according to the available data) and Abstracts Views on Vision4Press platform.
Data correspond to usage on the plateform after 2015. The current usage metrics is available 48-96 hours after online publication and is updated daily on week days.
Initial download of the metrics may take a while.