Fig. 2
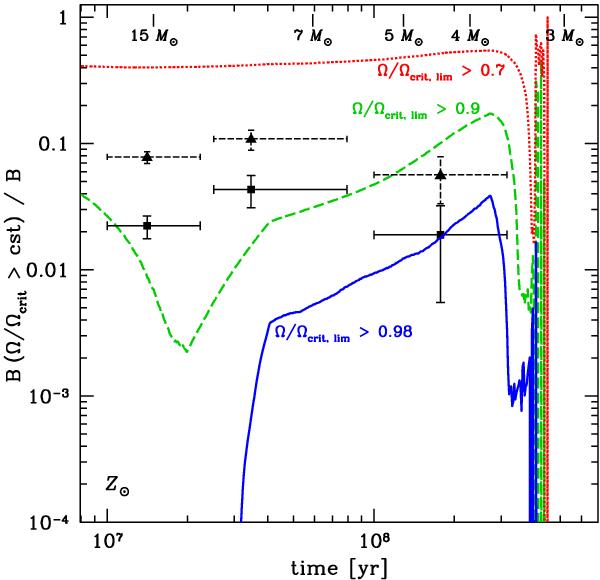
Evolution of the fraction of stars that rotate faster than a given limit in clusters of various ages at Z = 0.014, taking the Huang et al. (2010) distribution of velocities as the initial velocity distribution. The observational points represent the observed Be/(B+Be) ratio (McSwain & Gies 2005). The squared symbols (solid error bars) are for confirmed Be stars, and the triangle symbols (dashed error bars) are for all Be-type stars. The ticks at the top of the plot show the typical lifetime of stars with various initial masses.
Current usage metrics show cumulative count of Article Views (full-text article views including HTML views, PDF and ePub downloads, according to the available data) and Abstracts Views on Vision4Press platform.
Data correspond to usage on the plateform after 2015. The current usage metrics is available 48-96 hours after online publication and is updated daily on week days.
Initial download of the metrics may take a while.