Fig. 6
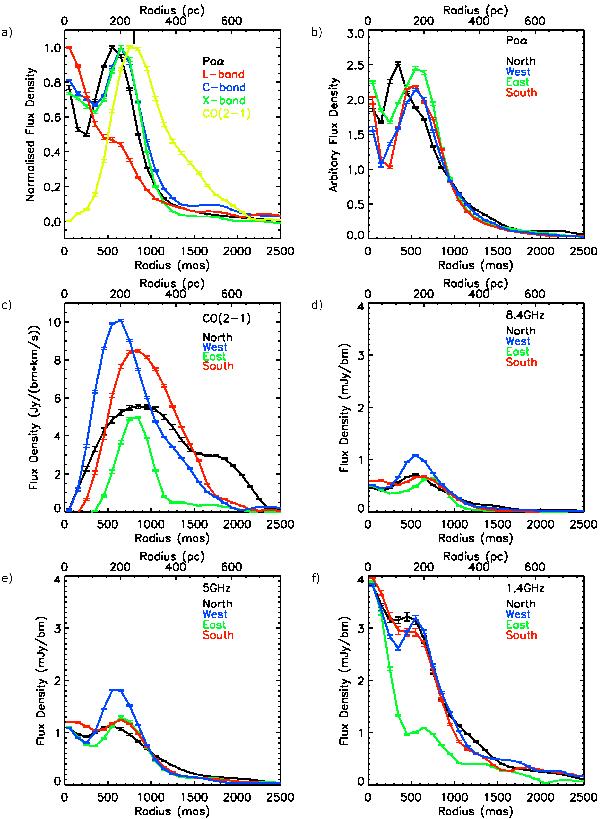
Comparison of the annular profiles of the new CO (2−1) data with Paα, 8.4 GHz (X-band), 5 GHz (C-band) and 1.4 GHz (L-band) data from Olsson et al. (2010)a), top left. These profiles, obtained by azimuthally averaging the flux density in 0.1′′ wide annular circular rings, are nominally centered on the center of the Paα ring. Profiles of each tracer in different regions of the ring are presented from top right to bottom left: Paαb), CO (2−1) c), 8.4 GHz d), 5 GHz e) and 1.4 GHz f). Spatial resolutions of the data used for the profiles are ~0.2′′ for Paα, ~0.3′′ for the L-, C- and X-band observations and the spatial resolution for the CO data is ~0.5′′.
Current usage metrics show cumulative count of Article Views (full-text article views including HTML views, PDF and ePub downloads, according to the available data) and Abstracts Views on Vision4Press platform.
Data correspond to usage on the plateform after 2015. The current usage metrics is available 48-96 hours after online publication and is updated daily on week days.
Initial download of the metrics may take a while.