Fig. 5
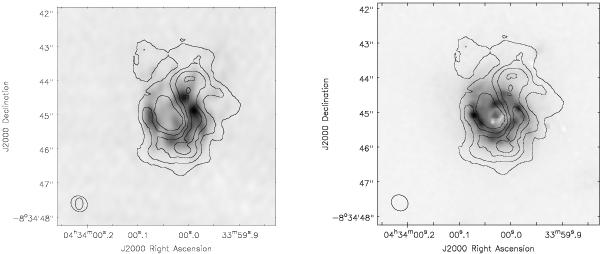
Overlay of the CO (2−1) integrated intensity contours on the VLA 8 GHz emission (grayscale, left, Olsson et al. 2010) and overlay of the CO (2−1) integrated intensity emission (contours) on the Paα emission (grayscale, right, Olsson et al. 2010). The contour levels for the CO (2−1) emission are at 18.5, 41, 60.5, and 81% of the emission peak (same levels as in Fig. 2).
Current usage metrics show cumulative count of Article Views (full-text article views including HTML views, PDF and ePub downloads, according to the available data) and Abstracts Views on Vision4Press platform.
Data correspond to usage on the plateform after 2015. The current usage metrics is available 48-96 hours after online publication and is updated daily on week days.
Initial download of the metrics may take a while.