Fig. 1
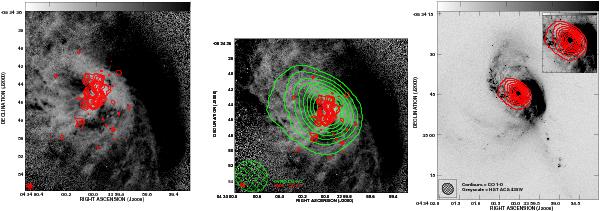
Overlay of the CO (2−1) integrated intensity emission (left, Olsson et al. 2010) and of the CO (2−1) and low-resolution CO (1−0) (middle, Olsson et al. 2010) integrated intensity emission on the HST F435W/F814W filter color-map image, and overlay of the CO (1−0) emission (right) on an HST F435W filter image on the scale of the whole merger system. Note how well the CO (2−1) emission distribution correlates with the dust lanes (light gray colors on the left-hand side and the middle in this figure) and that the position of the emission peak of the CO (1−0) distribution coincides with the main part of the dust emission in this region. The CO beam sizes (CO (2−1): 0.50′′ × 0.44′′, CO (1−0): 4.44′′ × 4.10′′) are shown in the lower left corners.
Current usage metrics show cumulative count of Article Views (full-text article views including HTML views, PDF and ePub downloads, according to the available data) and Abstracts Views on Vision4Press platform.
Data correspond to usage on the plateform after 2015. The current usage metrics is available 48-96 hours after online publication and is updated daily on week days.
Initial download of the metrics may take a while.