Free Access
Fig. 9
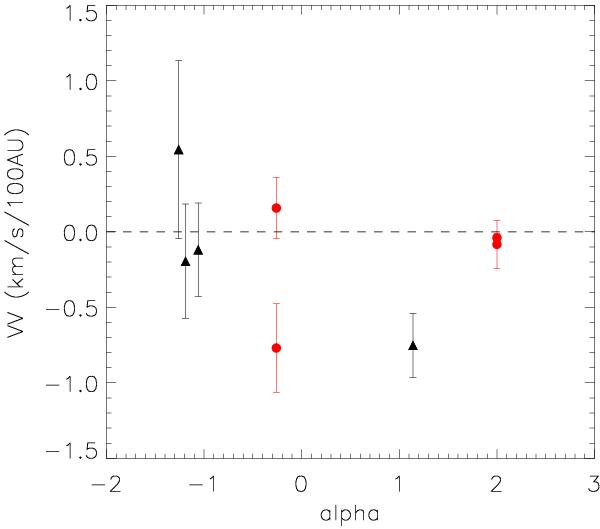
Variation in velocity along outflow plotted against de-reddened spectral index of outflow source. The VVs of each lobe for the bipolar outflows are marked with the red circles while the VVs for the single-lobe outflows are labeled with the black triangles. The error bars represent the uncertainties of the linear fittings.
Current usage metrics show cumulative count of Article Views (full-text article views including HTML views, PDF and ePub downloads, according to the available data) and Abstracts Views on Vision4Press platform.
Data correspond to usage on the plateform after 2015. The current usage metrics is available 48-96 hours after online publication and is updated daily on week days.
Initial download of the metrics may take a while.