Free Access
Fig. 8
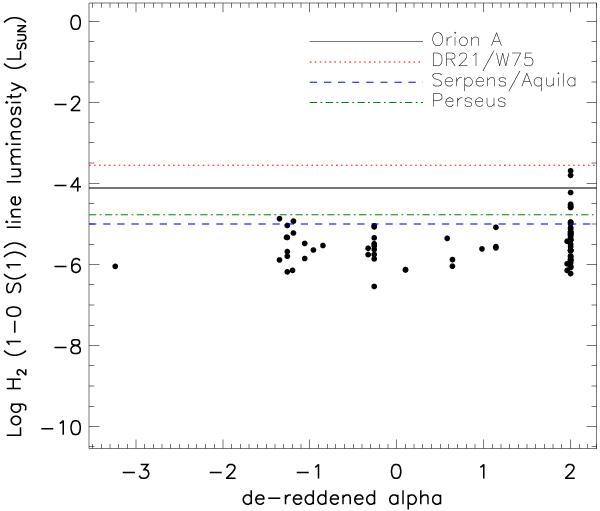
H2 1-0 S(1) line luminosity plotted against source spectral index, α, for the MHO features in Ophiuchus. The black solid line, the red dotted line, the blue dashed line, and the green dot-dashed line show the detection limit from (Davis et al. 2007, 2008, 2009, priv. comm.; Ioannidis & Froebrich 2012a,b), respectively.
Current usage metrics show cumulative count of Article Views (full-text article views including HTML views, PDF and ePub downloads, according to the available data) and Abstracts Views on Vision4Press platform.
Data correspond to usage on the plateform after 2015. The current usage metrics is available 48-96 hours after online publication and is updated daily on week days.
Initial download of the metrics may take a while.