Free Access
Fig. 7
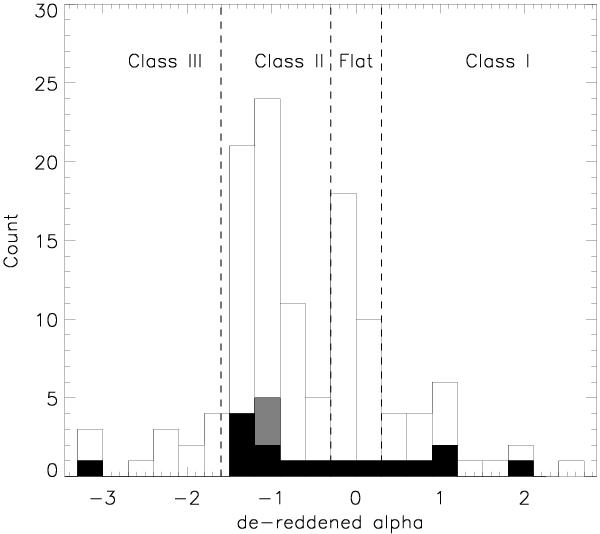
Histogram of the de-reddened spectral indices (in bins of 0.3) of all YSOs (Evans et al. 2009) located inside the polygon in Fig. 4 (open columns), all H2 flow sources identified by this paper (filled gray columns), and H2 flow sources excluding those associated with the three newly detected flows (filled black columns).
Current usage metrics show cumulative count of Article Views (full-text article views including HTML views, PDF and ePub downloads, according to the available data) and Abstracts Views on Vision4Press platform.
Data correspond to usage on the plateform after 2015. The current usage metrics is available 48-96 hours after online publication and is updated daily on week days.
Initial download of the metrics may take a while.